 ArcView Tutorial 2: Creating Access Maps ArcView Tutorial 2: Creating Access Maps
Adding and Editing Polygon Themes
You will now add polygon data to the ArcView project, in this case for sections, townships, and ITM quads.
Adding
Polygons. First, add the polygon themes for Secd96,
Twpspoly, and Itmquads from gis_data\grids. You can add multiple
themes at one time by opening the folders (clicking on the green boxes) of
all the themes you need to add and then holding down the shift key as you
click on each polygon. **DO NOT ACTIVATE THE
SECTIONS THEME AT THIS TIME .. IT IS HUGE AND TAKES MINUTES TO DRAW!!!**
Editing the Drawing order of the Itmquads theme.
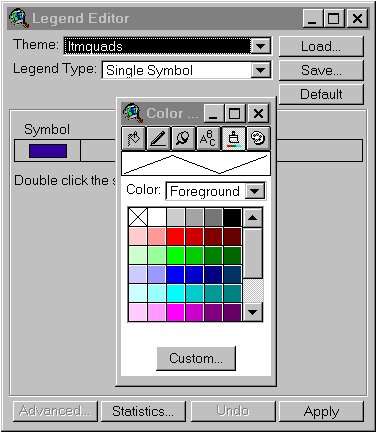 Changing the color of a polygon theme. Now you will
change the color of the itmquads theme so only the outline will show.
When you add a theme to the project it will come up as a default
(seemingly random) color.
Sometimes you will want to change the color of the theme – an example is
that the symbol box is blue. Some themes are also available only as polygons,
so that if you don’t want a fill color you need to make it transparent. Whenever you are working on a
particular theme, make sure it is selected. If you don’t you will be making
changes to the wrong theme. To change color of the Itmquads theme (or make
it transparent), 2x the theme, which will open the Legend
Editor. 2x the symbol and the Palette manager will open. Click the paintbrush
icon. Click on the color you want (or the x’d box for transparent in this
case) and click
"apply" on the Legend Editor window. The color should have changed
to transparent with only the outline showing.
You will need to do this for every theme you want to change.
Changing the color of a polygon theme. Now you will
change the color of the itmquads theme so only the outline will show.
When you add a theme to the project it will come up as a default
(seemingly random) color.
Sometimes you will want to change the color of the theme – an example is
that the symbol box is blue. Some themes are also available only as polygons,
so that if you don’t want a fill color you need to make it transparent. Whenever you are working on a
particular theme, make sure it is selected. If you don’t you will be making
changes to the wrong theme. To change color of the Itmquads theme (or make
it transparent), 2x the theme, which will open the Legend
Editor. 2x the symbol and the Palette manager will open. Click the paintbrush
icon. Click on the color you want (or the x’d box for transparent in this
case) and click
"apply" on the Legend Editor window. The color should have changed
to transparent with only the outline showing.
You will need to do this for every theme you want to change.
Labeling the
itmquads theme. Some layers and themes have data
stored that is reference to the geographic information represented on the map
(welcome to GIS). It is possible to label the different quads with their names
(i.e. Karluk B5), which is quite helpful. The Label feature  is used to accomplish this. First, make sure you are zoomed so that the entire
area you are working with is on the view. Use the magnifying glass tool
is used to accomplish this. First, make sure you are zoomed so that the entire
area you are working with is on the view. Use the magnifying glass tool
to draw a box around your area of interest and
the hand
 to move the
map if necessary. Draw a box around Kodiak.
Whenever you are using the label feature it is best to set text size before
you begin. By default, ArcView uses a 14 point font, which is usually
too big. To do this, hit Ctrl-P and click the font palette
to move the
map if necessary. Draw a box around Kodiak.
Whenever you are using the label feature it is best to set text size before
you begin. By default, ArcView uses a 14 point font, which is usually
too big. To do this, hit Ctrl-P and click the font palette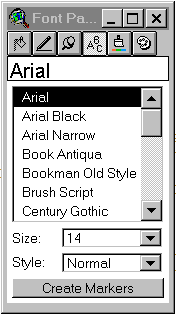 button
and change font size to 7 point, then close window. To label the
Itmquads theme, either use Theme; autolabel or Ctrl-L (make sure the
itmquads theme is selected). The Auto-label
window will open (left). In the Label field dialog box, scroll to
" quad.name" and click "Use Theme's Text Label Placement Property" and check "Label only features in
View Extent". Click OK. You should see that quad names were added to the
quads. If all quads are not labeled you may have to label by hand. Now
you will attach the quad names to the theme by selecting Edit; Select all
graphics; then Graphics; Attach Graphics. Now
deactivate the itmquads theme to see if the quad names you added disappear
with the theme. You
can also change font size or move labels around the quad. Click the Label icon
and then click in the middle of each quad that isn’t already marked.
Click on the label you want with the black pointer  . Hit Ctrl-P.
This will bring up the Font palette (at right). You can then select 7 or 9
point and you should see the font change. You can then minimize the font palate
and move the text wherever you like. Turn the itmquads theme off.
. Hit Ctrl-P.
This will bring up the Font palette (at right). You can then select 7 or 9
point and you should see the font change. You can then minimize the font palate
and move the text wherever you like. Turn the itmquads theme off.
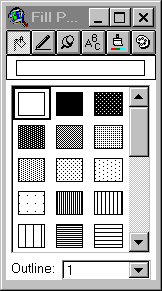 Zooming to the area of interest.
Editing the Township Theme
 .
Click the button and draw a box around the entire area you want to
clip. Theme; Convert to shapefile; and save as
township.shp in your project folder. When it asks if you want to add
it to the project as a view, click yes. Delete the original Twpspoly
theme (Select theme; Edit; delete themes) and select, change color to
transparent, make border 1, and activate the township theme you just
created.
.
Click the button and draw a box around the entire area you want to
clip. Theme; Convert to shapefile; and save as
township.shp in your project folder. When it asks if you want to add
it to the project as a view, click yes. Delete the original Twpspoly
theme (Select theme; Edit; delete themes) and select, change color to
transparent, make border 1, and activate the township theme you just
created.
Editing Labels in a theme.
Make sure text size is still 7 point. Use Ctrl-L and
autolabel as before. You’ll notice that the 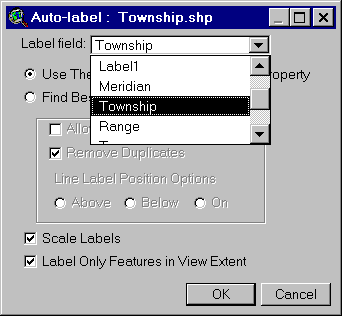 labels are in the middle of
the quads instead of near the township lines – this will be the same with
ranges, so you need to edit the township labels; however, you only need to
label the townships down one side and the ranges across the map once.
Click here for an example. 2x each text label (black
arrow tool), which will
labels are in the middle of
the quads instead of near the township lines – this will be the same with
ranges, so you need to edit the township labels; however, you only need to
label the townships down one side and the ranges across the map once.
Click here for an example. 2x each text label (black
arrow tool), which will bring up the text properties box. Edit the
031S to read T31S (T meaning township, use R for Range). Edit them and
move them close to the lines. Now
repeat for the ranges – the only difference is that you will use the
rotation box after you 2x click on the label and change rotation angle to
270 degrees so it
lines up with the range lines. Look at the examples
of completed maps if you have questions.
Adding the Sections theme. Now you will add the Sections theme. Add
the polygon theme. Don't activate yet, but make sure it is
selected. This one is really big and takes a long time to load and
manipulate. You
want to do this right the first time. Zoom out 2x or so
from
your area of interest. Turn it on. It will take a while to draw.
Now
you will select a portion of the theme and clip it to make it more
manageable, which is the same process you used for townships. Select Feature
, draw a box, Theme; convert to
shapefile and save it as section.shp in the folder you are using
for the map. Add it to the current view. Turn the old
section theme off and the new one on. Make it transparent. This one should load much quicker.
Label the
sections, using a small font (maybe 4), using the same options as when you
labeled the townships.
Continue with Tutorial
Previous item in Tutorial
Return to ArcView Tutorial 2: List of Topics
Return to Main Menu